
Behind the seemingly technical phrase “Expected Goals (xG)” lies a quiet revolution in soccer analytics. By assigning a probability value to every shot, xG offers an objective lens on chance quality—yet under the hood, sophisticated statistical models raise plenty of questions about their construction.
What are Expected Goals (xG)?
An Expected Goal (xG) quantifies the likelihood that a specific shot will end up in the net. To calculate it, the model compares each attempt against tens of thousands of past efforts in a historical database and assigns a probability between 0 and 1. The nearer the figure is to 1, the more certain the model is that the attempt should be converted.
How do “Expected Goals” Work?
A modern xG engine digests multi-layered inputs:
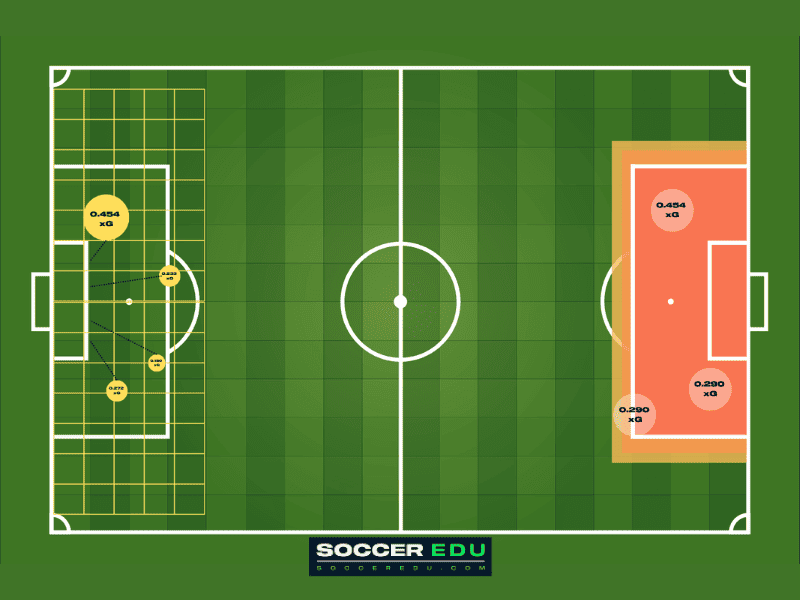
- Shot distance – closer efforts carry higher probabilities.
- Angle to goal – central looks produce better odds than acute-angle strikes.
- Defensive pressure – proximity and positioning of defenders dilute the % chance.
- Shot type – headers, volleys, chips, and driven attempts all receive distinct baselines.
- Body surface – stronger foot ≫ weaker foot, while headers often trail both.
- Ball velocity – power increases the keeper’s degree of difficulty.
- Trajectory & placement – curled top-corner attempts outrank rolled efforts into the keeper’s gloves.
- Pre-shot context – quality of assist, first-touch control, and buildup tempo add extra nuance.
By turning Chance Creation into single-number probabilities, analysts can benchmark players and game plans across leagues, eras, and tactical systems.
Who Invented Expected Goals?
The idea of evaluating shot quality dates back several decades, starting with the work of Vic Barnett and Sarah Hilditch. Building on their foundation and advances in technology, statisticians and soccer analysts spent years developing models to measure scoring chance quality.
However, it was the rise of big data and increased computing power that helped expected goals become widely used and essential in Soccer Analysis.
How is xG calculated?
xG is calculated using algorithms that factor in a wide range of variables.
Each shot is analyzed and matched with thousands of comparable situations in the database, and then assigned a probability between 0 and 1. The closer the xG score is to 1, the higher the likelihood of scoring.
Do xG Include Blocked Shots?
Yes — Blocked Shots (those that don’t reach the goal due to a defensive block or interception) are included in xG calculations. However, their xG value is usually lower than that of a shot on target.
How Are Blocked Shots Accounted for in xG?
- Reduced xG value: A shot that’s blocked before reaching the goal sees its xG score decrease significantly.
- Factors influencing that reduction: Depending on the model, this could be based on which body part blocked the ball (foot, leg, chest…), the distance between the defender and the goal, or the defender’s position at the moment of the block.
Why Include Blocked Shots in xG?
- Better accuracy: Including blocked shots gives a more complete picture of the quality of scoring chances.
- Fair comparison: Counting blocked shots allows for a fair comparison between players. For example, if two strikers have the same number of shots on target, but one has more blocked attempts, xG can help differentiate their actual efficiency.
Are Penalty Kicks Included in xG?
Yes, penalties are included in xG calculations. The xG value of a penalty is typically high — around 0.8, because statistically speaking, penalties are converted most of the time.
Why isn’t a Penalty’s xG Equal to 1?
One might assume the xG for a penalty should be 1, since it’s taken from close range with no defenders in the way. But penalties can still be saved by the goalkeeper or missed completely.
That’s why no shot can ever have an xG of 1 — it would imply 100% certainty, which doesn’t exist in the sport.
Why Include Penalties in xG Analysis?
- Offensive efficiency: A penalty typically results from a defensive error that disrupts a promising scoring chance. Including penalty xG gives a more complete picture of a team’s offensive performance.
- Evolution of penalty tactics: This also allows analysts to study changes in penalty trends — like how goalkeepers adapt or how efficient shooters are over time.
The Limitations of xG
While powerful, xG is not an exact science and should be interpreted with caution. Several factors not included in xG models can influence a game’s outcome, such as:
- Goalkeeper Overperformance: A spectacular save might stop a goal even if the xG was high.
- Luck: A deflected shot with low xG could still go in.
- Psychological Factors: Pressure, confidence, or fatigue can all affect a player’s finishing.
Why Are xG Useful in Soccer?
xG offers valuable insights to coaches, video and performance analysts, and recruiters:
Individual performance analysis
This metric helps evaluate how effective players are in front of the goal. By comparing a player’s xG to their actual goals, you can assess finishing quality. For example, a striker with a low xG might not be getting enough clear-cut chances — suggesting a tactical adjustment is needed.
Team performance analysis
xG also reflect defensive strength. A team with low xG conceded likely has a solid defensive setup.
Coaches can also identify areas of improvement. For instance, a team with high possession but low xG might struggle to create real chances — meaning training should focus on final-third decision-making.
Top 10 MLS Teams by xG – 2023/2024 Season
To illustrate how xG is used, here’s a ranking of MLS Teams with the highest average xG per match during the 2023–2024 season:
| Rank | Team | Avg. xG per match (2024) |
|---|---|---|
| 1 | Los Angeles FC | 1.75 |
| 2 | FC Cincinnati | 1.68 |
| 3 | Austin FC | 1.64 |
| 4 | Seattle Sounders | 1.60 |
| 5 | Columbus Crew | 1.57 |
| 6 | Inter Miami CF | 1.52 |
| 7 | Sporting KC | 1.48 |
| 8 | New York Red Bulls | 1.45 |
| 9 | Philadelphia Union | 1.43 |
| 10 | Toronto FC | 1.40 |
How Do Soccer Professionals Use Expected Goals?
xG data is used differently depending on the role:
- Data Analysts: Combine xG with other stats (duel win rate, successful dribbles, etc.) for more comprehensive evaluations.
- Coaches: Use xG to assess player efficiency and team weaknesses, and to guide training and tactics.
- Video Analysts: Evaluate the quality of chances created and conceded, and assess tactical shifts.
- Scouts: Use xG to assess striker efficiency and compare offensive profiles.
- Agents: Present clients’ xG stats to clubs to increase their market value.
The Value of xG: A Concluding Thought
Expected Goals (xG) has finally become a pillar of contemporary Soccer Analytics. Beyond basic goal counts, they provide a sophisticated and objective lens by which to assess attacking output and defensive solidity, hence helping us to grasp the actual quality of opportunities generated and surrendered. xG offers coaches, analysts, recruiters, and agents unmatched knowledge of tactical effectiveness, player efficiency, and strategic development
Though it is very perceptive and potent, xG is a probabilistic model, not a predictive crystal ball; therefore, remembering this is vital. Its capacity to call conventional tales into question and bring underlying performance trends to light is where its power lies. But for a real holistic knowledge of the lovely game, xG should always be analyzed in combination with other supporting data metrics—such as ball progression, defensive action rates, possession quality, and individual player activities like successful dribbles or key passes—and, crucially, with the seasoned eye of human observation.
It enables data-driven decision-making and promotes a greater understanding of the complex dance between chance generation and conversion on the pitch.